Many roasters are using the bean curve i.e. the temperature development of the bean in the drum as a tool to understand the heat dynamics in the drum, to analyze roast profiles and better see bakings or other unpreferred behavior. While the bean curve has been the core around which to wrap the profiling process it showed that there was serious competition on the rise...literally: The Rate of Rise curve
The Rate of Rise (RoR) curve displays the increase (or drop) in bean temperature over a given period of time. But why is this information so crucial for the quality of a roast? Well, mathematically speaking the RoR is the growth rate of the bean temperature over time and hence telling you how fast temperature of bean is changing. So for example a RoR of 5 over a period of 30 seconds means that the actual bean temperature is rising 5 degrees per 30 seconds or 10 degrees per minute. A RoR of -5 means the opposite: The temperature dropped by 5 degrees.
How does that support you while roasting?
Know the velocity of bean temp increase.
Image Nr 1 below shows you two curves in blue. One is the bean curve, the other one rising from minutes 2:30 is the RoR. At that moment the RoR is approx 8, which means the bean temperature rises 8 degrees per 30 seconds.
So the RoR tells you if you the heat in the bean develops at the velocity youre wanting, also considering that a too low RoR can indicate baking.

Graph 1 : Cropster Roast RI - RoR indicating velocity of temp increase during a roast
Be ahead of time.
The RoR acts stronger and earlier to temperature changes than the usual bean curve.
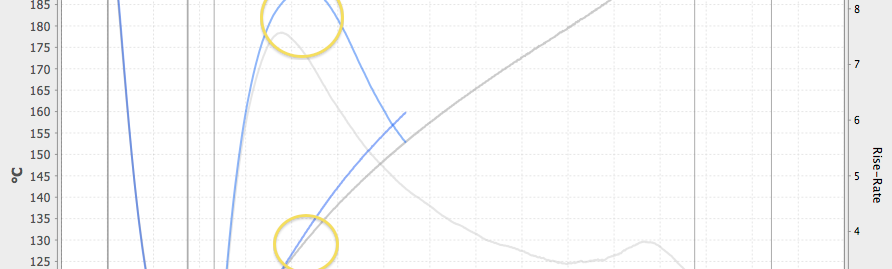
In the screen shots below we can see the references of the bean and RoR curve in gray and the actual bean temp and RoR appearing in blue. The example in Graph 2 clearly shows that the actual RoR differs from the reference RoR pretty early. While this irregularity is very obvious on the RoR curves, you can hardly see it in the bean temperature itself at that stage.

Graph 2 : Cropster RI2 - Irregularities during a roast process at duration 3:00 min

Graph 3 : Cropster RI2 - Irregularities during a roast process at duration 6:30 min
The RoR in Graph 2 has shown already at 3:00 min that we heat up faster than in the reference curve, while the bean temperature gradually starts to reveal this info at around 4:00 min (Graph 3).
Therefore the RoR referencing allows you to react before it is too late.
Achieve consistent heat development
A bumpy RoR may be a signal of uneven heat development. In one way or another this will affect aroma development so it is something that you want to know about. The images below show you two different roasts in comparison. The bean temp curves in the upper part of the graphic reveal the difference in absolute temperature, but show very little in the development of the temperature over time. This is what the RoR curves at the bottom do. It can clearly be seen that the development of the blue curve is not constant, because the RoR draws bumps stronger and earlier.


Graph 4 :: Cropster Roast - Roast Compare with bean temp (top) and RoR (bottom) comparison
Cropster : RoR as a Reference
The Rate of Rise has become an integral part of Cropsters roasting software Roasting Intelligence. With the increasing usage and feedback of that parameter for coffee roasters all over the world we keep committing more and more to this tool. Recently, we incorporated the RoR as a reference curve alike the bean temp reference curve in our software RI2. This will help roasters understand how fast the heat is developing within the bean, react earlier to irregularities and interpret the (non)-uniformity of the heat development over time. This is of course not the only way to see this trend, but we think it is an easy-to-use real time tool to better understand your roasts.
This is a summary of how we see the RoR and how it is implemented in Cropster RI2. We built the new RoR referencing feature upon initial ideas and feedback from Ed Bourgeois, James Hoffman and Ben Kaminski. Recent feedback and trial data came from Filip Akerblom. Thanks for the support!
What are your opinions about it? Do you have more experience you want to share? We are happy to do so.


