Cupping, Quality and Data – you’ve got it. Use it!
| Cup
Written by Andy Benedikter, Paul Bartholomew
Table of Contents
With Cropster, collecting the data can be automatic. Thanks to the latest developments, analysis can also be automated to deliver better information, in real time, across coffee businesses.
Let’s take a look at some questions we have heard from the industry:
- 1. How can I easily compare 50 coffee samples from Brazil?
- 2. Which Ethiopian coffee developed a “peach” flavour?
- 3. Which coffee has the strongest sweetness for my clients espresso blend component?
- 4. How does the quality of my roasts develop over time?
- 5. How consistent are my cuppings? Is the panel consistent?
- 6. Which changes to my roast profile result in more desirable flavors/cup quality?
Quality Compare answers all these questions by tying cupping results to green coffee, roast batches and cuppers in Cropster. Your cupping creates a deep knowledge database and this new tool provides a results focussed view to dig into that data and get simple but sometimes elusive answers.
Quality Compare moves your business from a single cupping result to an overall view of your product and production.
What does combining detailed cupping to your green & roasted coffee look like?
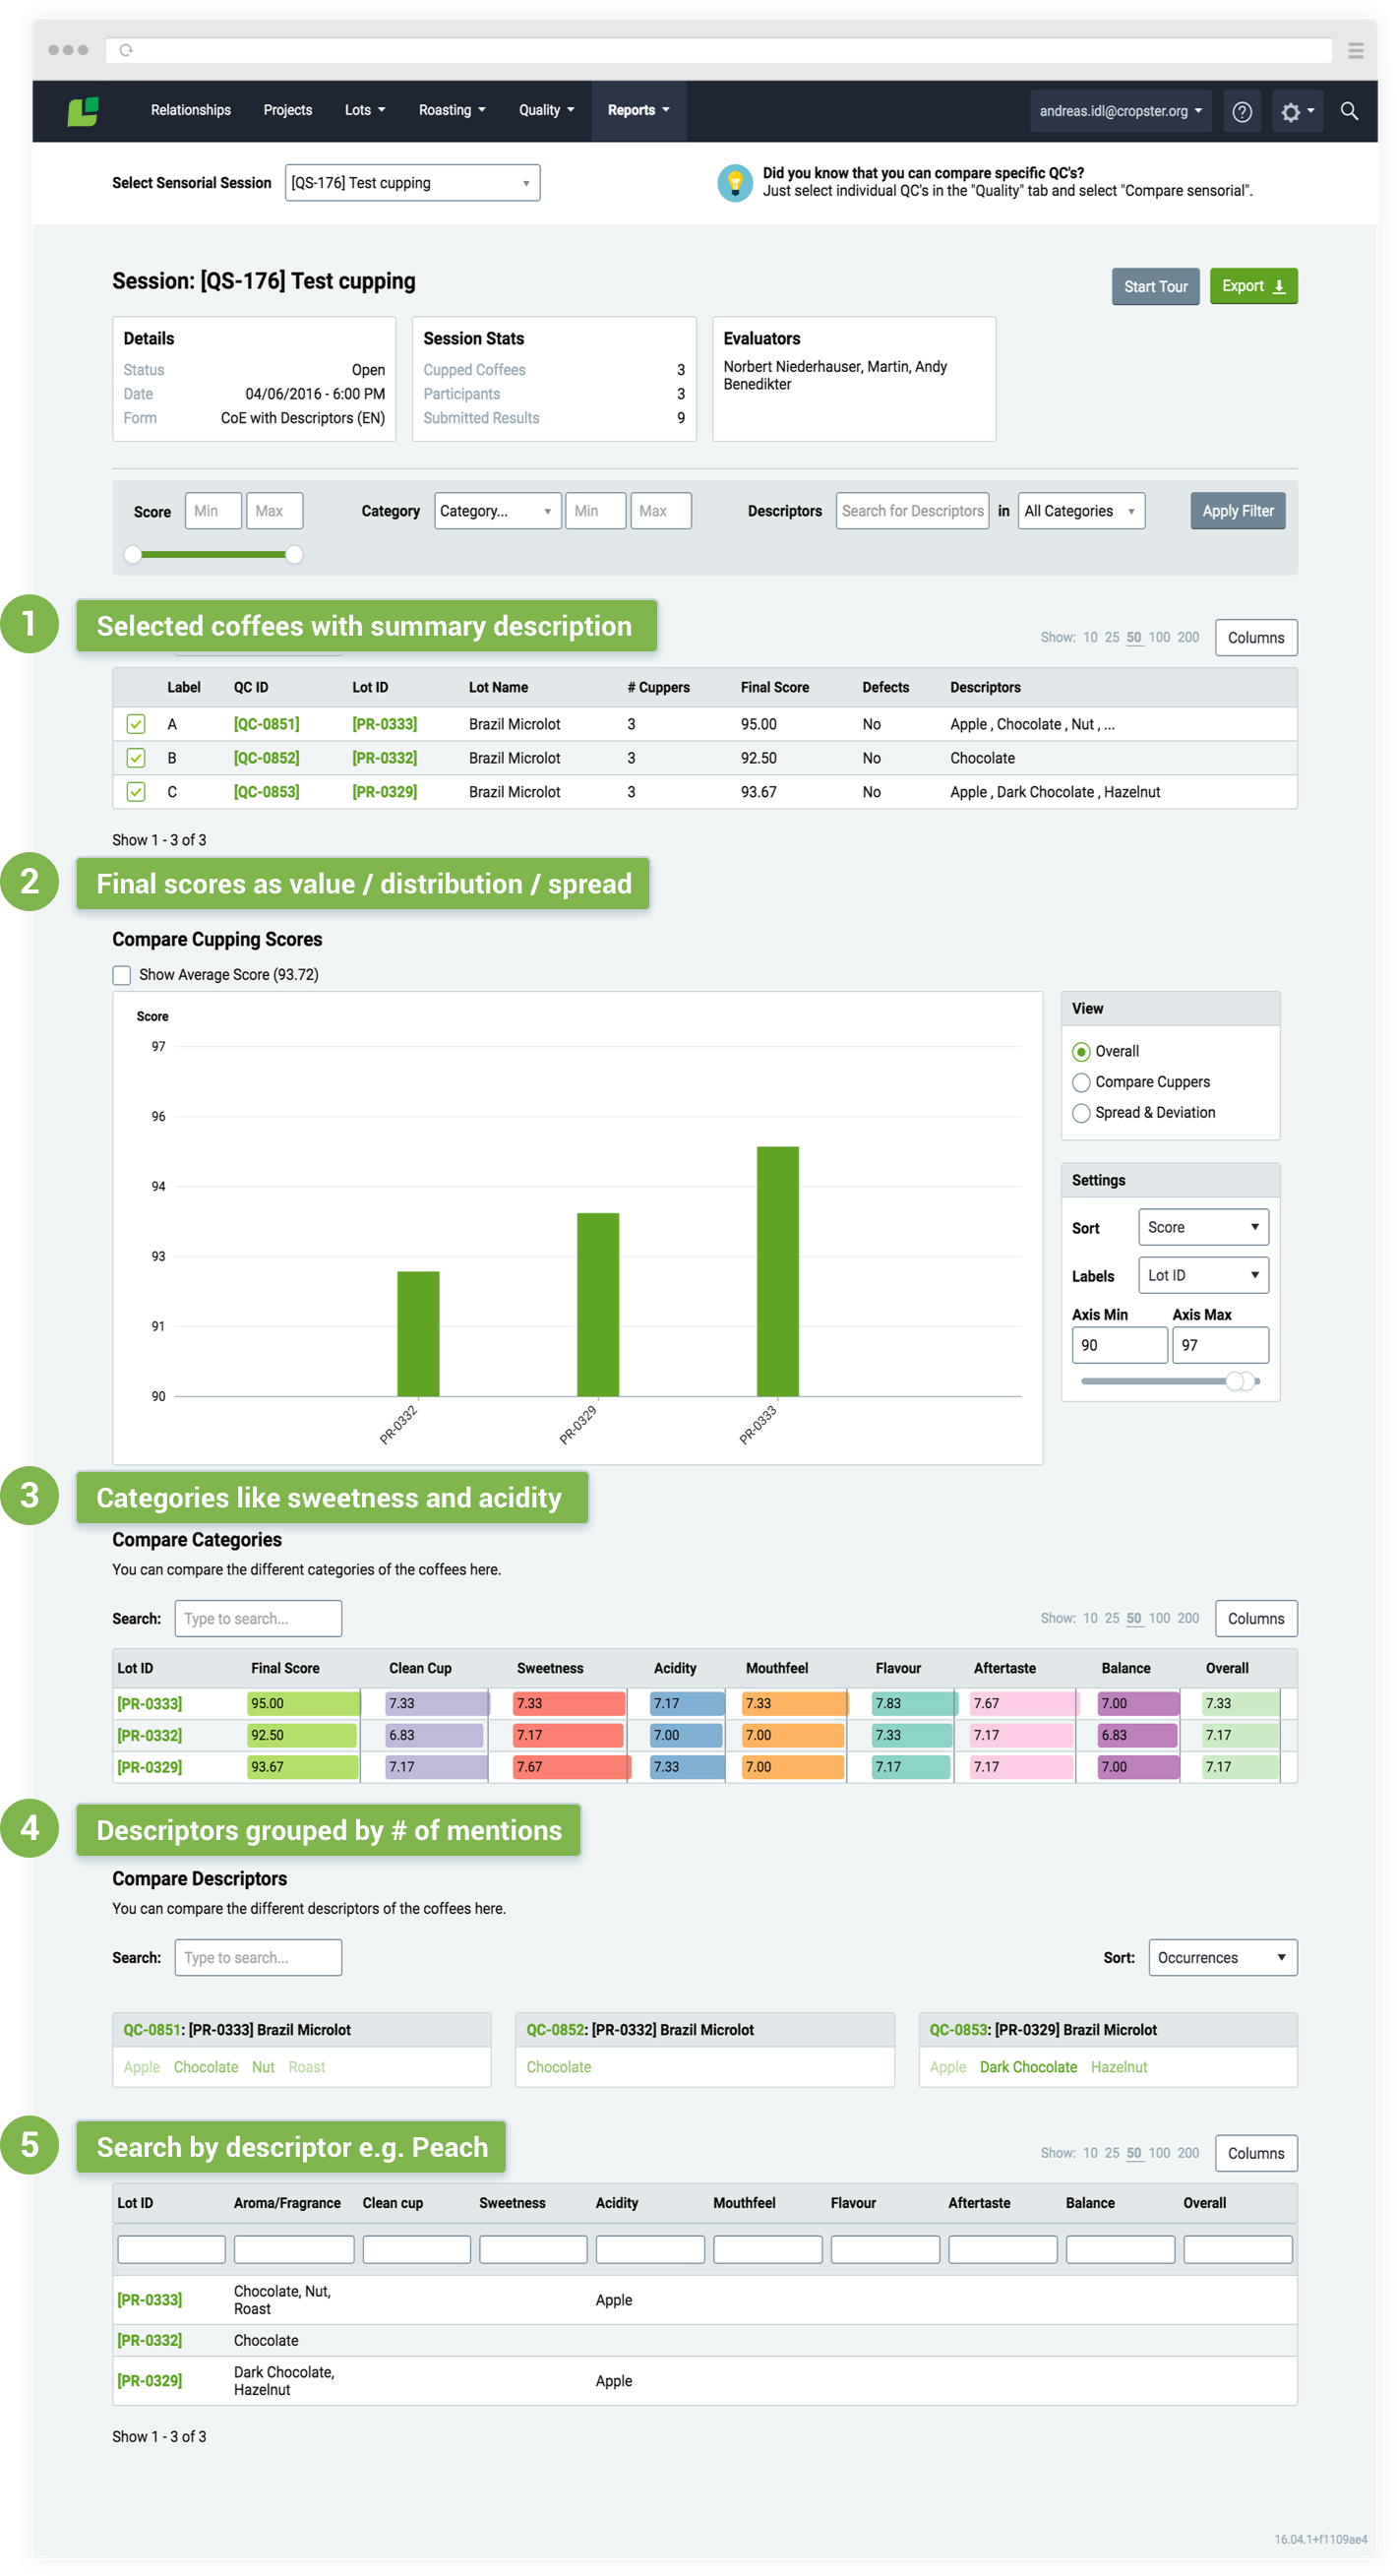
Browse and filter by any quality characteristic
You can reduce your selection by setting a minimum or maximum quality score. You can also filter any score on categories like acidity or sweetness and search for descriptors in these categories. Descriptors are shown as tag clouds based on their count during the cupping. That means the “Hazelnut” coffee will stand out immediately.

After refining the list press “Apply Filter” to generate the outputs in three different levels: (1) Final Scores, (2) Categories (e.g. sweetness) and (3) Descriptor e.g. (hazelnut)
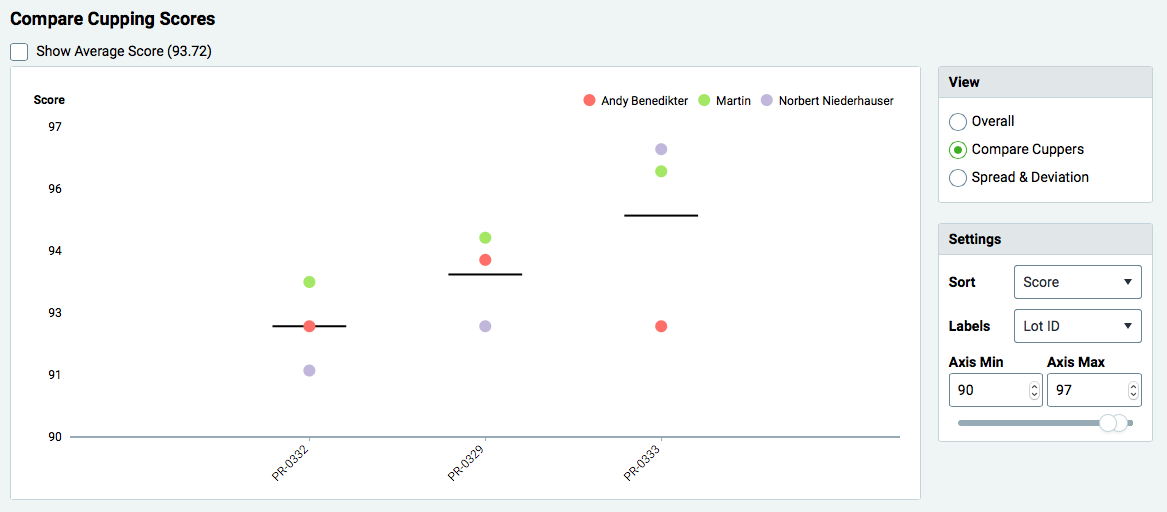
Final Scores, the first overview
The final scores of all selected coffees are compared against each other. The chart picks up a final single value, the spread of the cupping panel compared to the average (show) or the scores sorted over time.
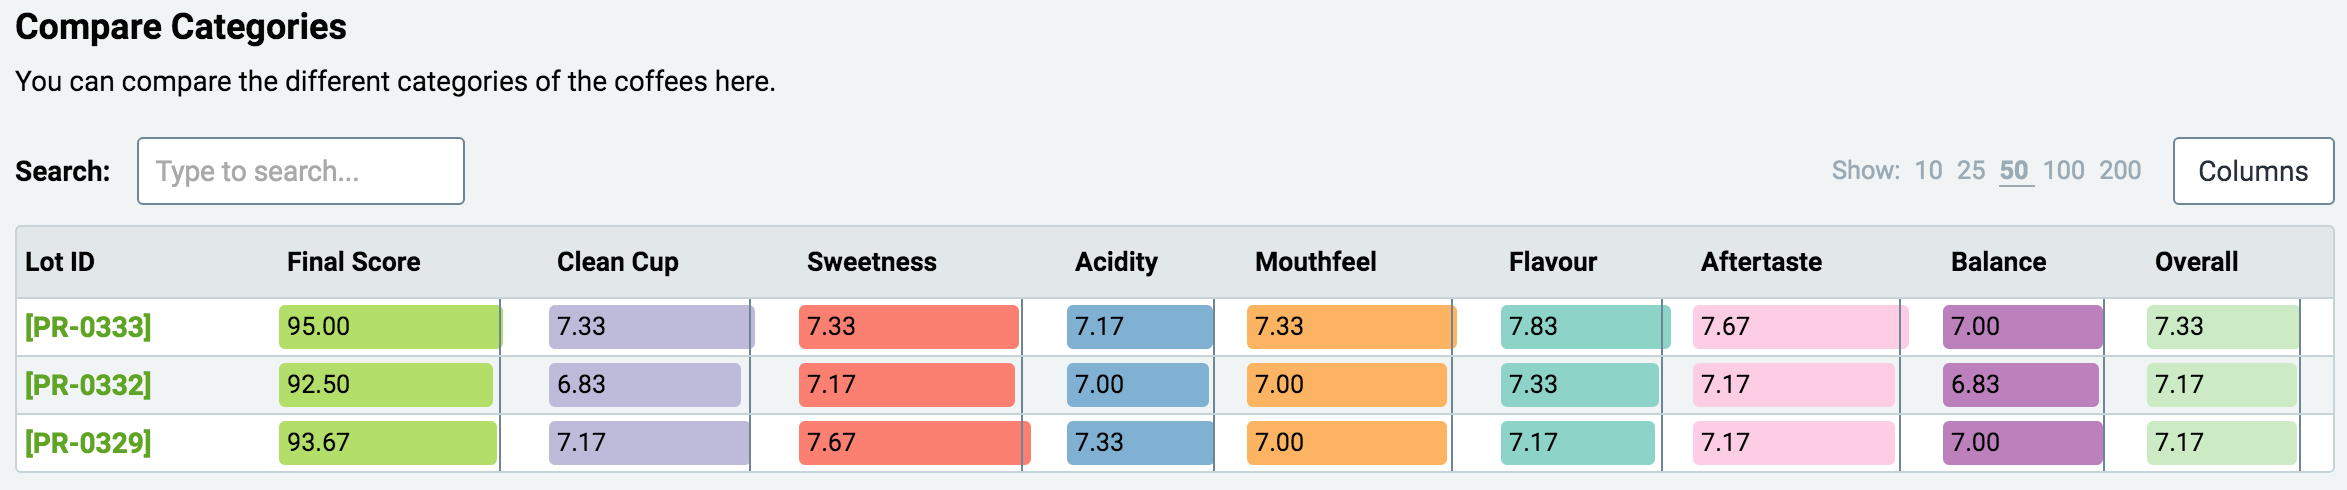
Find the highest sweetness: Categories
The “Compare categories” view shows scores per category in a comprehensive bar chart. Sort and compare them to highlight the coffees with the most pronounced sweetness or acidity. Are there similar coffees from the same supplier which perform differently on that sweetness you are looking for? Does your portfolio cover the most important flavor characteristics that your customers long for? Do you have the right coffee for your customer’s blend component?
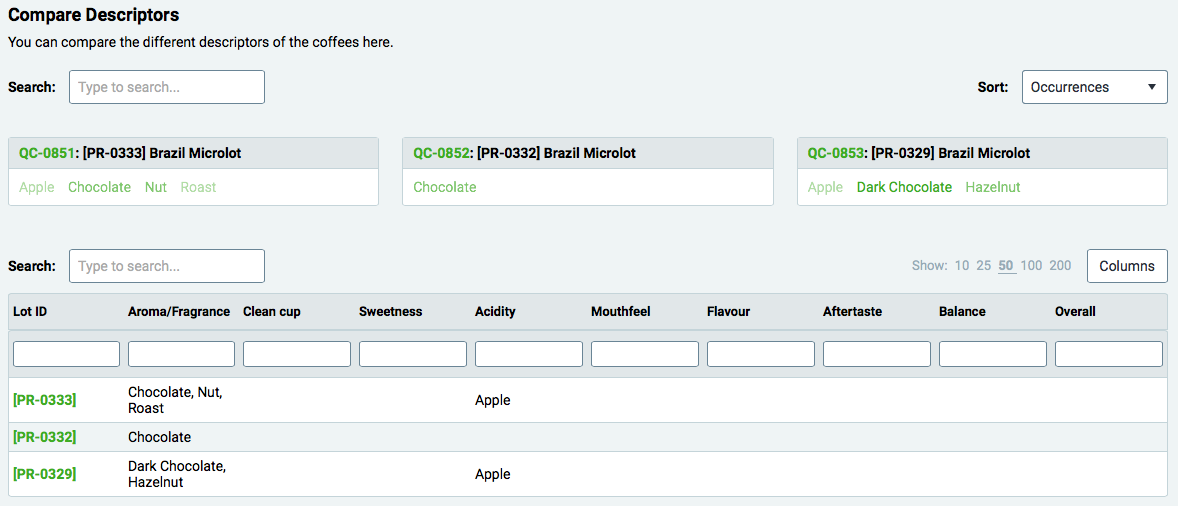
Browse flavours: Descriptors
Descriptors are the next step. The report provides two views on that. First let’s see how many times “peach” was found in the coffee. Did all cuppers agree on that? Second you can live filter all descriptors to highlight the lots that meet your search criteria.
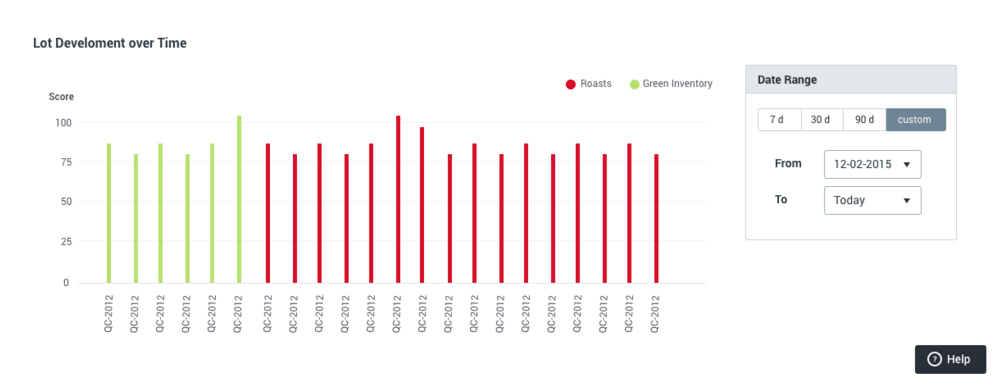
Show quality tendencies over time
Over time you will collect more and more quality data. Reaching from production cupping scores to detailed sample assessments of the coffees that you bought or rejected.
Traditionally most of this information is lost or hidden across unindexed cupping sheets, Cropster stores and organizes everything you cupped and shows you the quality development of samples, lots and roast batches over time.
Think about your process from the point you request a sample. You cup it several times on its way to you. Now you can easily capture the overall quality and the detailed potential of that coffee across cuppings. As a result, you can make a more data driven decision to buy that coffee and use it for your roast production. Over the lifetime of the green coffee lot, you will do several production cuppings to see if the roasting process gets the best out of the raw product and if the green coffee still lives up to your expectations.

Cropster traces any coffee – and the quality data stored – from sample through roasting. Our single Quality Control graph shows you how the quality of a sample, green lot or roasted batch evolves over time.
How deep you want to go into Quality Control depends on your needs. The new reports are here and give you feedback on every step in cupping. No matter if it is only final score cupping, you will start to see trends. But keep in mind, the more cupping you do the greater the insights.