How does altitude affect the dynamics of coffee roasting and ultimately influence quality?
| Origin
Table of Contents
“If we’re sharing our roast curve data, is that even useful if we’re at such different elevations?”
Joe Marocco, FairWave Coffee Collective
Saving and sharing your roasting data is fantastic, but sharing the context for that data may be the key aspect. We have learned from companies like Third Wave Water how important it is to eliminate variability when sharing your coffee so you can be on the same tasting page as everyone else. As we progress into the future as an industry, we will need to look deeper into the context of the data we use so we can make smarter decisions in our roasteries.
Deep dives into the data are much simpler these days thanks to easily accessible tools like Cropster that collect and present information in a standardized way. The best part is that these days such tools even capture the data for you automatically. That is why Cropster partnered with Ikawa to do a mini-study into answering our questions on altitude and roasting. Thanks to our partnership, Ikawa roast data is easily accessible for analysis within Cropster.
In this article you’ll learn how Joe Marrocco, Rob Hoos, Erik Stanek, Ikawa, and Cropster came together to make a first attempt at figuring out what is going on when roasting at different altitudes. We’ll cover the questions we had, the structure we used for our study, and use excerpts from our “How High?” webinar on April 20th to give context to all of this. If you’d rather watch or listen, you can check out the whole webinar online here.
Some of our initial questions were:
What differences occur when roasting at various altitudes? How does air pressure affect this? And most importantly why should we care if altitude doesn’t change for our roastery?
Here’s Joe Marrocco on why we should care about altitude:
“I’ve heard many people dreaming of this future where we can exchange roast profiles easily. Let’s say I have a client that has an Ikawa that they’re roasting samples on and I have an Ikawa that I’m roasting samples on. Plus, the farmer that we’re buying from also has an Ikawa they’re roasting samples on. Well, if we all share the same profile and we all use something like Third Wave Water with distilled water then we think automatically that we’re all tasting the same thing. But we’re not really seeing things as clearly as we should. It’s likely that me sitting here at 900 feet, a farmer who’s sitting at maybe 3000 feet, and another roaster who may be at sea level are going to be roasting in very different conditions. If that roaster is roasting at sea level and they have some feedback about the coffee and that exact profile, that feedback may come through to someone else in the chain as ‘oh they’re tasting the coffee wrong’ or ‘something’s wrong with the coffee’, ‘something changed in transit’, whereas it could literally just be the profile. Eliminating variables is extremely important when we discuss communication, especially about a target on a coffee. The more variables we understand the more that we can eliminate those variables and control them. Cupping data exchange along the supply chain is all about eliminating those variables.”
With this in mind, our aim was to identify if differences occur in the roasting processes for a single coffee roasted at different altitudes using the same roast profile and roasting machine.
To accomplish this, we broke down our review and analysis processes into three phases:
- Preparation
- Roasting
- Evaluation
Phase 1 – Preparation
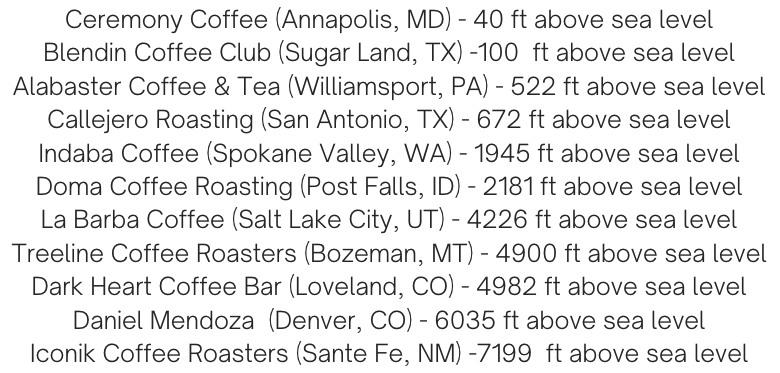
We put together a team of roasters who are also IKAWA users and had green coffee allocated by the Balzac Brothers. The coffee was a washed Bourbon & Caturra from Huehuetenango, Guatemala that was produced between 1500-1800 MASL. We selected the team of roasters based on a semi-even variation in altitude between 0 to ~7,200 ft above sea level. Cropster sent out AmbientSensors to monitor environmental variables, as well.
The reason we liked the Ikawa sample roaster for this experiment was for its ability to reproduce a roast by simply loading it in and essentially pressing “play”. Using its exhaust and inlet temperature sensors, the Ikawa will input the prescribed amount of temperature into the roast. If your Ikawa is connected to Cropster then the roast data recorded can be uploaded to your Cropster account where further analysis can occur. Cropster and Ikawa products were invaluable tools to do this experiment.
Phase 2 – Roasting
- Three IKAWA roast profiles provided
- Low, medium, and high development profiles
- 450g green coffee received by roasters
- 9 roasts in total at 50g/roast
- Three roasts of each profile
- Participants take notes on roast stages, collect start/end weight, and export data from IKAWA
- All three roasts of each roast profile were mixed to create around 120g of roasted coffee for each profile’s coffee and sent to Rob Hoos for analysis.
- AmbientSensor data recorded and combined for analysis
With these three different roast profiles we wanted to better understand how coffee changes at various altitudes while using a light, medium and dark roast profile. The idea was to have each of the roasts similar but to stretch out the development time to affect the overall roast value. The profiles range from 6:00-9:30 minutes.
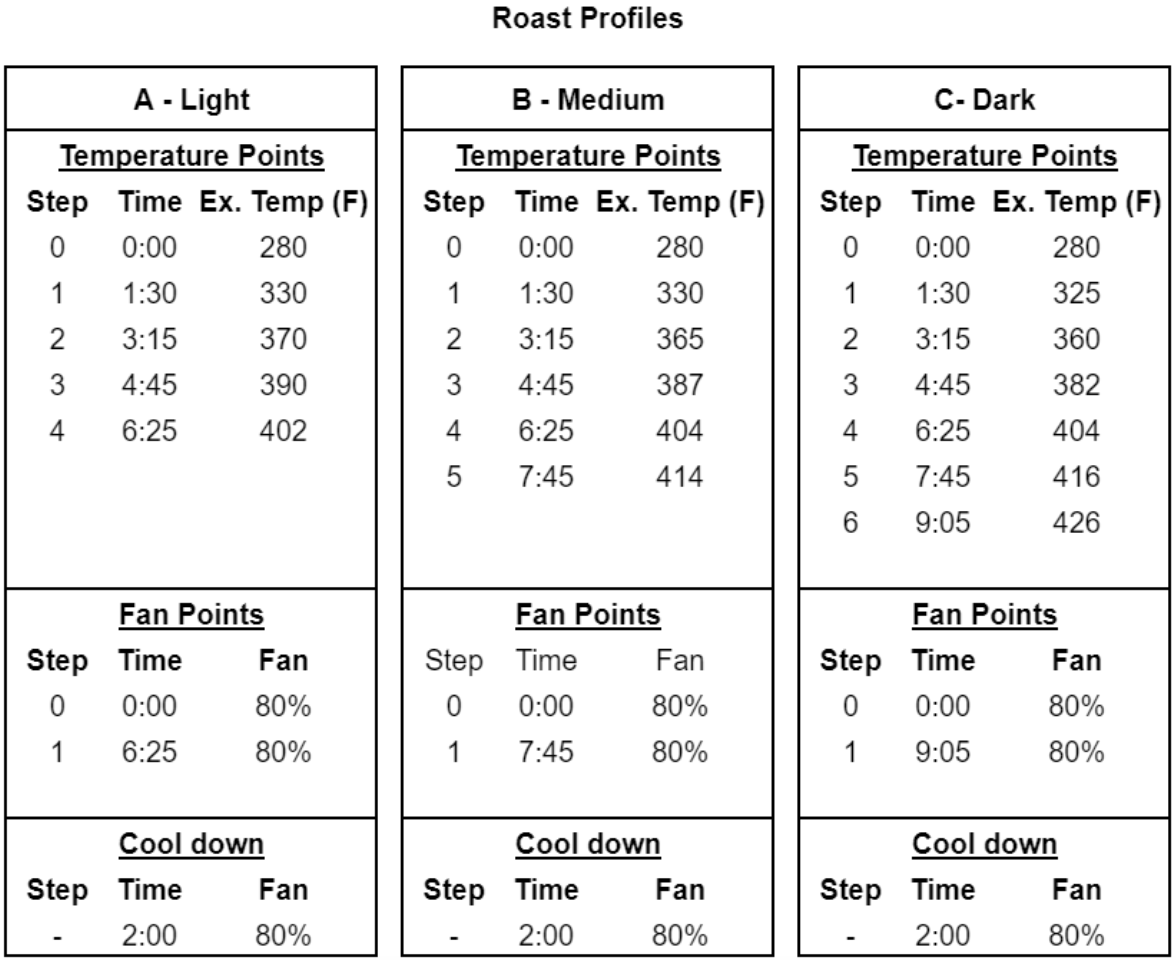
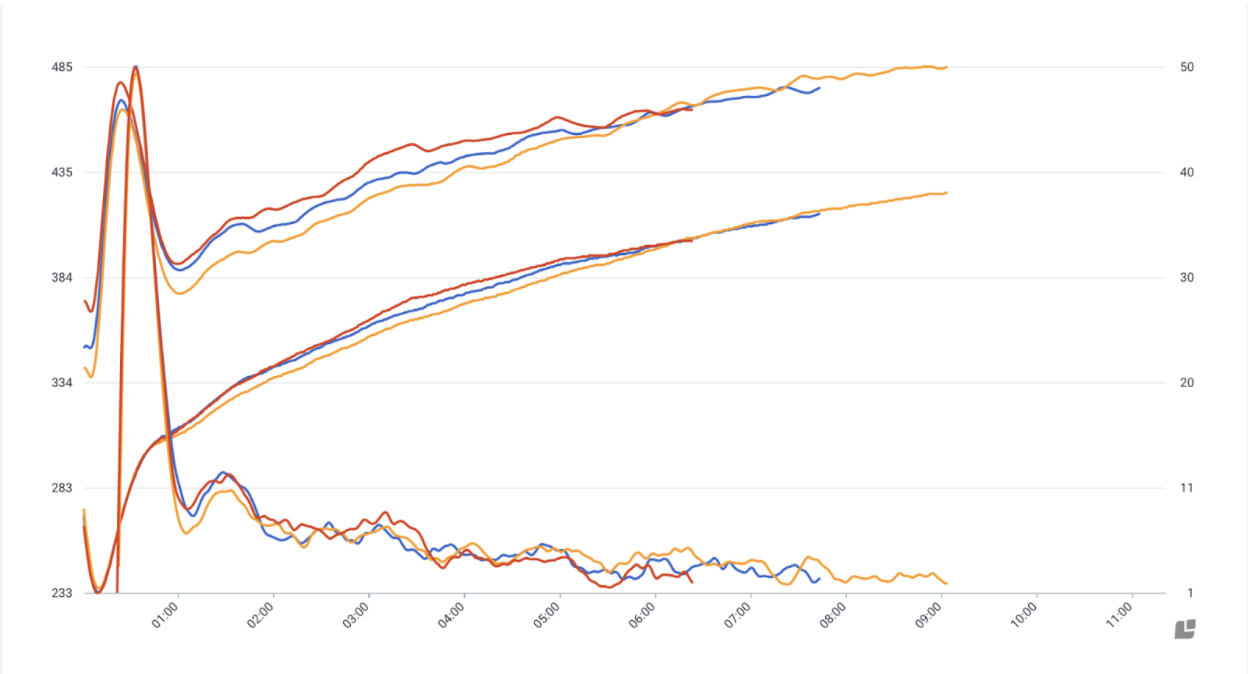
Roast Compare report in Cropster showing Roasts A,B, and C
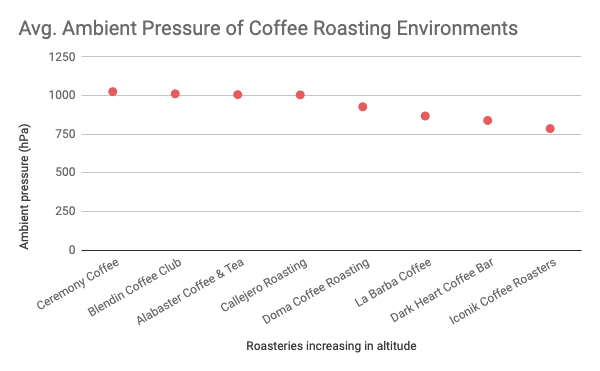
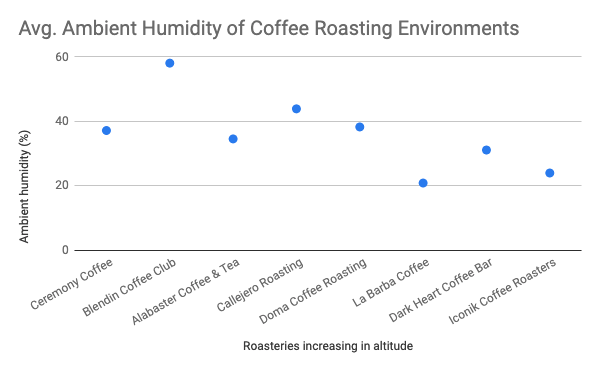
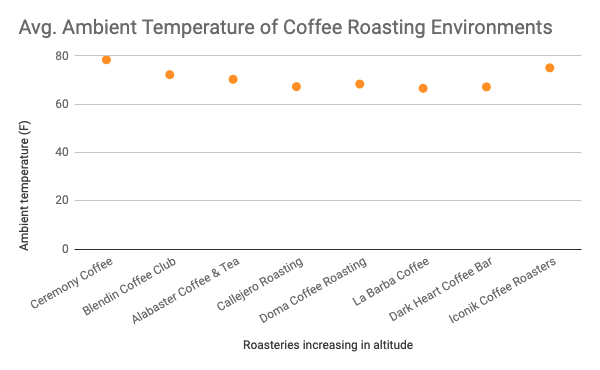
Data below:
- X-axis – increase of altitude from left to right
- Recorded with Cropster AmbientSensors in roasting environment
Data below:
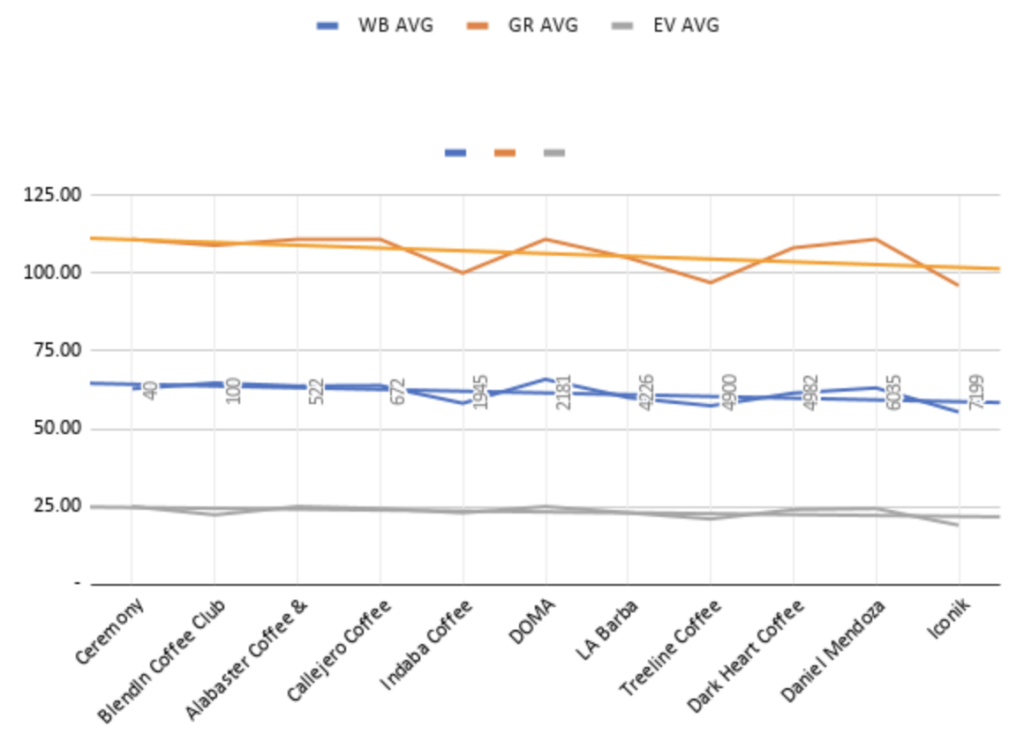
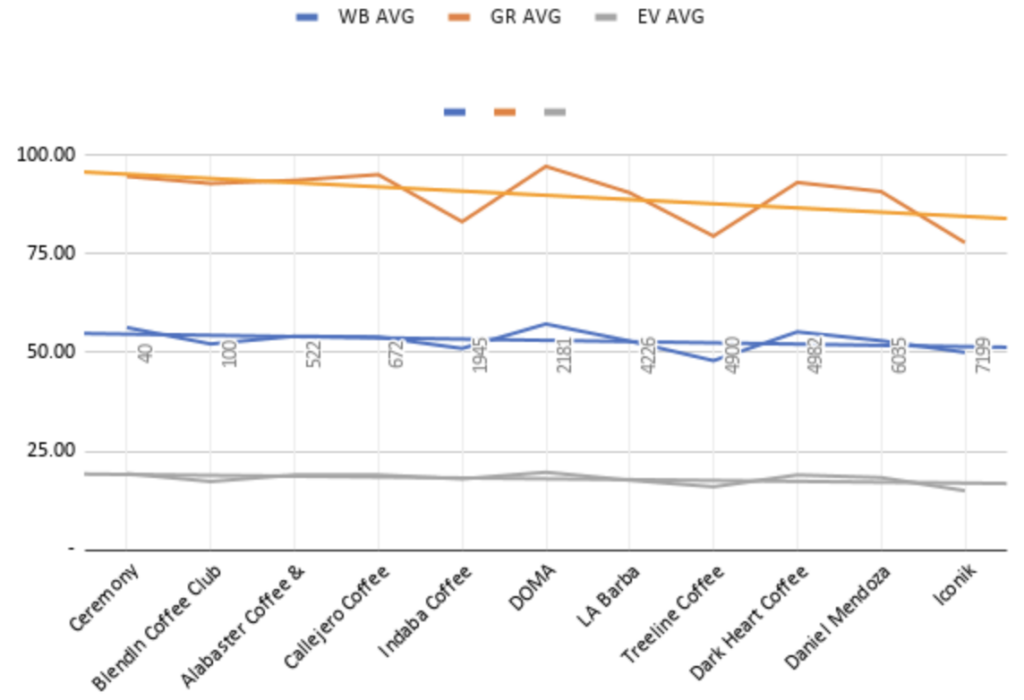
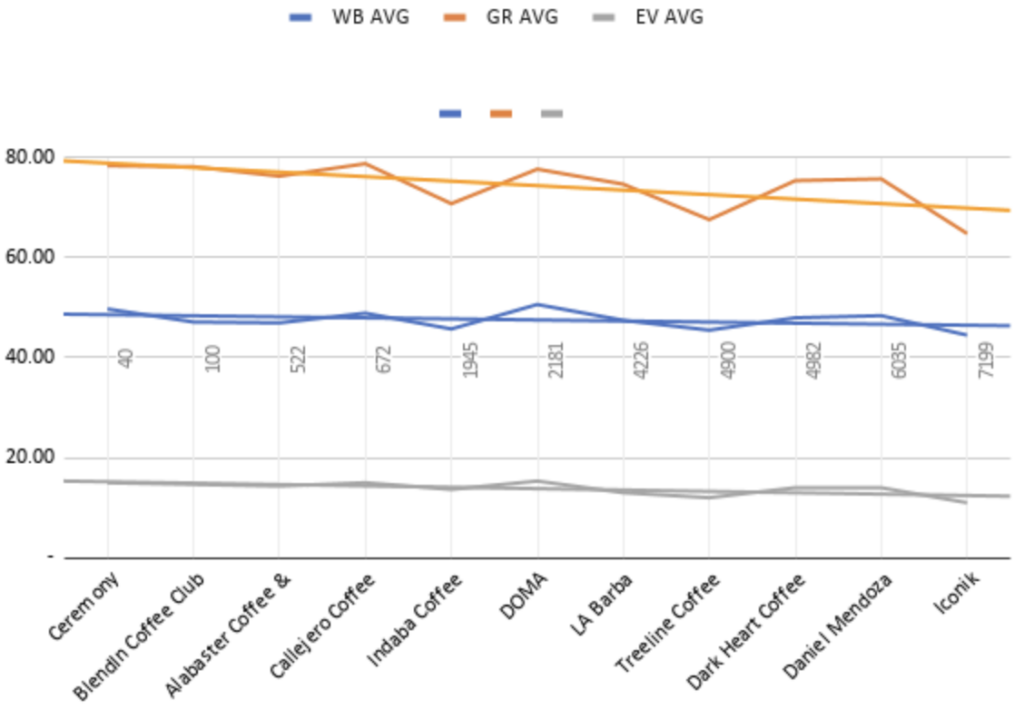
- Agtron values (lower scores = darker color)
- X-axis – increase of altitude from left to right
WB – Whole Bean
GR – Ground
EV – Espresso Vision
All Roast A – “Light Roast”
All Roast B – “Medium Roast”
All Roast C – “Dark Roast”
Phase 3 – Evaluation
With each of the three types of roasts, light, medium and dark, the trend line of roast value goes from lighter to darker as altitude increases. In the webinar, Erik Stanek talks about why this trend line always went from light to dark with higher altitude. “At higher altitude the roast comes out darker because the roast is applying more heat to achieve the same exhaust curve because the air density is lighter.” Rob Hoos commented “as you go up in altitude, the fan is going to be spinning at the same rate but the density of the air that you’re moving is going to be different and with the density difference in the air it is going to cause some differences in terms of how the roaster is going to roast the coffee because the Ikawa is measuring inlet temperatures and measuring exhaust temperature so it is not looping based on the actual bean temperature.”
Limitations of the Study:
Like most studies, this one had limitations. It’s important we (and you) understand what those were. Here are a few items that we considered when reviewing the data. We understand there’s more to be done to get to detailed conclusions.
- Only tested on one type of roaster that uses convection
- Small sample size
- Color analysis only
- Translating lessons to full size roast machines
- Used V2 and V3 Ikawa sample roasters only
Conclusion and Possible Next Steps:
When using the Ikawa to reproduce roasts, we saw roast values go from lighter to darker as altitude increases. At higher altitudes, the roast applies more heat to achieve the same exhaust curve because the air density is lighter. The fan is going to be spinning at the same rate but the density of the air that you’re moving is going to be different.
If we continue our exploration of this topic, our next areas of focus will be:
- Understanding how to match roasting profiles at altitudes
- Evaluate coffees roasted the “same” at various altitudes for quality differences beyond roast value
Thanks for making it this far. We hope that you learned something new! If you found this article interesting, please sign up for our newsletter below and you’ll always know about our latest educational initiatives. If you’d like to know what webinars we have coming up, you can always find out here.
